Multifamily Blogs
Google Ads Now Tracks Community Visits
Google Ads Now Tracks Community Visits

Apartment marketers have been longing for the day that they can attribute their ad spend to onsite community traffic. Google is making this dream a reality for more communities as they roll out store visit conversions in Google Ads. Up until this point, apartment marketers have been able to attribute ad campaign success in Google Ads through website traffic, website events, and phone calls. While these metrics do a great job of measuring the intent of searchers to visit a location, store visits allow communities to see how this online intent actually translates to foot traffic. In this blog post, I'll explain how Google tracks store visits, how apartment marketers can use this information to generate more foot traffic, and the criterion communities need to meet to be able to take advantage of this new metric.
Who can take advantage of Google’s store visits?
-
Communities that have a Google My Business account set up for each location and 90% of their location links verified
-
Communities using location extensions in Google Ads
-
Communities that received thousands of ad clicks and impressions
-
Communities that have enough foot traffic and pass user privacy thresholds
How does Google track store visits?
Google uses a variety of signals to arrive at the store visits data they report in your Google ads account. Google maps data, store locations, wi-fi signal strength in stores, GPS location signals, Google queries, visit behavior, and a sample of 1 million users who opted into allowing Google to track their location history are all used to determine and validate this metric. Google surveyed over 5 million people to confirm they actually visited a store and used this feedback to update their algorithms. Google is very confident about this metric, they’ve claimed that this data point is “99 percent accurate”. (WordStream)

How should communities interpret this data?
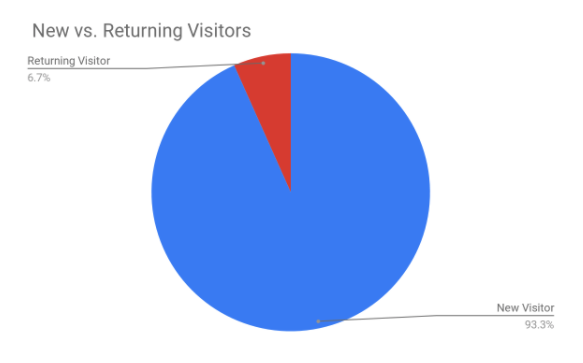
Advertisers can segment store visit data in Google ads by new and returning visitors. If your community is focused on generating new prospects, you can analyze your search campaign data to get a better idea of how new visitors are finding your community and which ad copy they engage with.

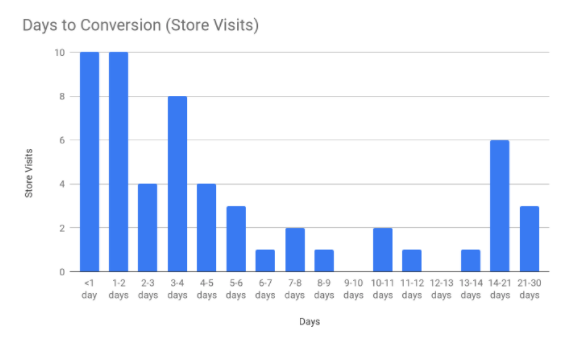
Marketers can also use store visit data to build better customer journey models. Advertisers can segment store visits by the number of days that elapsed between a prospect clicking on an ad and visiting the community using the “days to conversion” metric. This data becomes even more interesting when you break it down at the campaign level. Consider comparing days to conversion by brand and non-brand campaigns to get an idea of how long it takes prospects who uncovered your community through a non-brand search to visit you as opposed to someone who knew to search your community by brand.

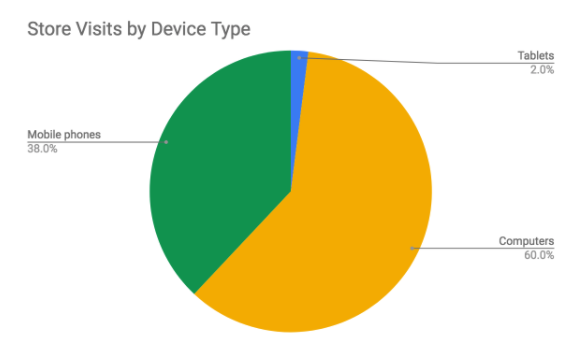
Using store visit device breakdowns, communities can find out which devices high converting prospects use to search for their community.

How can communities use this data to generate more store traffic?
This new metric opens the doors for communities to better attribute and optimize their Google Ads campaigns. Everything from ad copy, keyword targeting, location targeting, and device targeting can be evaluated by how effective they are at generating foot traffic. Once communities use this information to gain a better understanding of what drives foot traffic, they can reallocate their ad budgets and bidding strategies to hone in on the campaigns that generate the kind of results leasing teams are looking for.

