Multifamily Blogs
The Four Stages of Business Intelligence Maturity
The Four Stages of Business Intelligence Maturity

Information is power. Slowly but surely, multifamily housing is coming to realize how impactful business intelligence platforms can be. As we discussed in this year's edition of our "20 for '20" research paper on operations and technology trends, multifamily operators are putting more money and effort into implementing reporting and analytics capabilities. Yet we also found that the path is a long and winding one and that the level of satisfaction with such projects was, at best, mediocre.
Before anyone starts making business intelligence (BI) decisions, it's a good idea to understand some of the basics. In a white paper that I published a few years ago with multifamily BI guru Chris Brust, we described BI as follows:
"BI is a set of methodologies, processes, architectures, and technologies that transform raw data into meaningful and useful information to enable more effective strategic, tactical, operational insights and decision-making."
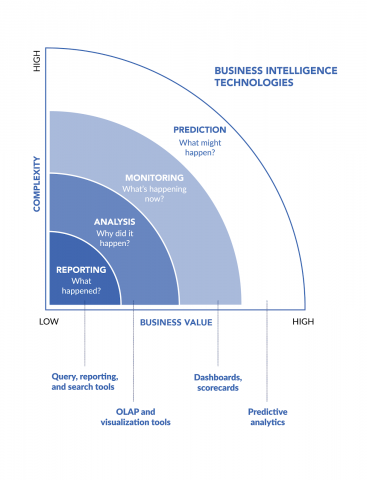
In practice, BI consists of four distinct stages, or functions, each more complex and driving more business value than the function below it. It is helpful to understand each of these functions and how they can benefit your business.
Reporting is the simplest and most ubiquitous of the functions. Reporting tells us all about things that have already happened. Reporting is static, rather than dynamic. Even reports that are highly parameter-driven do not allow users to dig more deeply, aggregate up, etc. thus limiting the insights they deliver. Also, by definition, reports are backward-looking, which also limits their value for forward-thinking decisions.
Reporting is important (even necessary) to the way that most businesses run. But rarely do reports make it obvious what to do next—what to change, what to keep the same, etc. Reports, queries and search tools give us an excellent sense of current or past state and pretty much end there.
Analysis occupies the next rung on the BI ladder. Analysis focuses on why things happened, making it much more valuable in making good decisions. Analysis is the world of visualization and Online Analytical Processing (OLAP). Graphs and infographics can connect data elements and present them in a way that makes their relationships more obvious. We can apply statistical processes to the data to give us a sense of how reliable those conclusions are. OLAP tools let us explore these relationships by drilling down to more granularity, up to higher levels of aggregation and across to find relationships that weren't immediately obvious.
The critical difference between reporting and analysis is that analysis enables us to explore the data and relationships efficiently rather than being limited to a more rigid view of the information. OLAP and visualization tools (like Tableau or PowerBI, for example) are key to this competency.
Monitoring takes us another level higher in complexity. Monitoring tells us exactly what is happening in the "here and now." It allows us to identify issues, intervene and correct them right away, rather than wait for a report to tell us how badly we did or a post mortem analysis to explain why the bad results occurred. Dashboards, scorecards and alerts allow us to make better decisions more proactively and avoid bad performance before it accumulates.
There is a term for this particular form of monitoring. "Operational business intelligence," sometimes called "real-time business intelligence," is an approach to data analysis that enables decisions using the real-time data that companies generate and use on a day-to-day basis. Note: in multifamily BI, we include both "near real-time" (i.e., data complete as of the prior night) with true "real-time" (i.e., data as of now). Monitoring leverages BI tools and algorithms to improve the day-to-day activities of front-line workers. Examples include tools to help control expenses, utilities, monitor renewals, etc.
Predictive analytics is the holy grail of BI. Unfortunately, it is also where the most snake oil is sold in analytics. Predictive analytics process data to come up with predictions of what might happen in the future. While not yet widespread in multifamily housing, some predictive analytics are already in the common technology stack. Examples include credit-scoring applications that predict likely bad debt and pricing and revenue management systems that predict optimal rents to balance occupancy and revenue.
The value of predictive analytics, when executed well, should be obvious: if we know something about the future, we have even more opportunity to affect that future, or at least to prepare for it as part of our decision-making process.
I find most multifamily operators are swimming in a sea of reports. Whether they realize it or not, they are desperate for the analytics and monitoring a robust BI platform provides. Except for a few special needs (like credit scoring and pricing as mentioned above), they don't need a lot of predictive analytics. Armed with an understanding of this BI maturity model, you can now assess where you are on that curve and what kind of OLAP, visualization and dashboarding will get you to the next level.
Photo by Jungwoo Hong on Unsplash

